Consumer Discretionary › Household Audio And Video Equipment

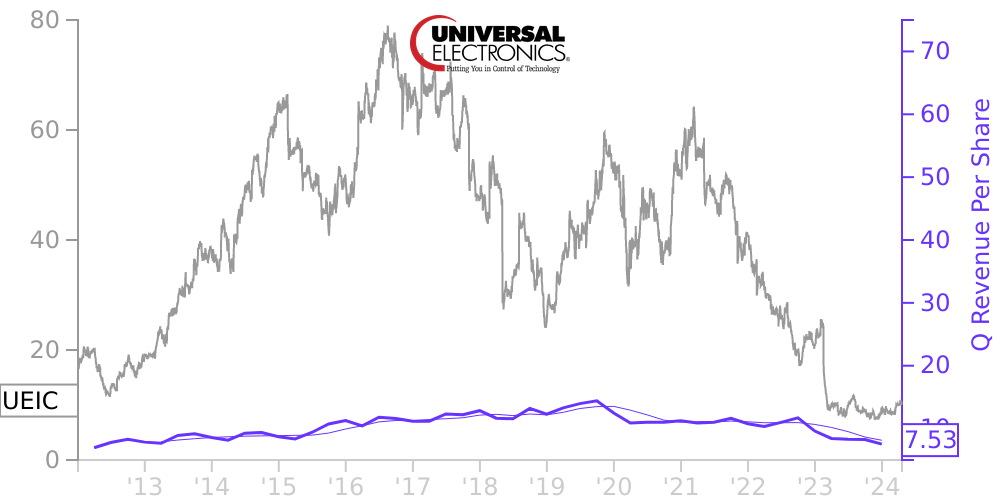
UEIC Stock Price Correlated With Universal Electronics Financials
External Links ⌄
Income Statement
Cash Flow
Balance Sheet
UEIC Income Statement
Enable JavaScript and reload
Revenue, Net:
Cost of Goods & Services Sold:
Gross Profit:
Selling, General & Admin Expense:
Research & Development Expense:
Total Operating Expenses:
Operating Income:
Income Taxes:
Net Income:
UEIC Cash Flow
Enable JavaScript and reload
Operating Activities Net Income:
Depreciation, Depletion & Amortization:
Change in Accounts Receiveable:
Net Cash from Operations:
Repurchases/Buybacks Common Stock:
Issuance of Long-term Debt:
Cash Dividends Paid:
Net Cash from Financing Activities:
Property, Plant & Equipment Purchases:
Purchases of Businesses, Net of Cash:
Net Cash from Investing Activities:
Net Change in Cash & Equivalents:
UEIC Balance Sheet
Enable JavaScript and reload
Cash and Cash Equivalents:
Short-Term Investments:
Accounts Receivable, Net:
Inventories:
Total Current Assets:
Property, Plant & Equipment, Net:
Total Assets:
Accounts Payable:
Current Portion of Long-Term Debt:
Total Short-Term Liabilities:
Long Term Debt, Non-Current Portion:
Total Long-Term Liabilities:
Total Liabilities:
COMPANY PROFILE
Note 1: Basis of Presentation and Significant Accounting Policies
In the opinion of management, the accompanying consolidated financial statements of Universal Electronics Inc. and its wholly-owned
subsidiaries contain all the adjustments necessary for a fair presentation of financial position, results of operations and cash flows for the periods presented. All such adjustments are of a normal recurring nature and certain reclassifications
have been made to prior year amounts in order to conform to the current year presentation. Information and footnote disclosures normally included in financial statements, which are prepared in accordance with accounting principles generally accepted
in the United States of America, have been condensed or omitted pursuant to the rules and regulations of the Securities and Exchange Commission. As used herein, the terms “Company,” “we,” “us,” and “our” refer
to Universal Electronics Inc. and its subsidiaries, unless the context indicates to the contrary.
Our results of operations for the three
months ended March 31, 2012 are not necessarily indicative of the results to be expected for the full year. These financial statements should be read in conjunction with the “Risk Factors,” “Management Discussion and Analysis of
Financial Conditions and Results of Operations,” “Quantitative and Qualitative Disclosures About Market Risk,” and the “Financial Statements and Supplementary Data” and notes thereto included in Items 1A, 7, 7A, and 8,
respectively, of our Annual Report on Form 10-K for the fiscal year ended December 31, 2011.
Estimates, Judgments and Assumptions
The preparation of financial statements in conformity with accounting principles generally accepted in the United States of America
requires us to make estimates, judgments and assumptions that affect the reported amounts of assets and liabilities, disclosure of contingent assets and liabilities at the date of the financial statements and the reported amounts of revenues and
expenses during the reporting period. On an on-going basis, we evaluate our estimates, judgments and assumptions, including those related to revenue recognition, allowance for sales returns and doubtful accounts, warranties, inventory valuation,
business combination purchase price allocations, impairment of long-lived assets, intangible assets and goodwill, income taxes and stock-based compensation expense. Actual results may differ from our expectations. Based on our evaluation, our
estimates, judgments and assumptions may be adjusted as more information becomes available. Any adjustment may be material.
See Note 2 to the
consolidated financial statements included in our Annual Report on Form 10-K for the year ended December 31, 2011 for a summary of our significant accounting policies.
New Accounting Pronouncements
The Financial Accounting Standards Board (“FASB”)
did not issue any Accounting Standards Update (“ASU”) during the first quarter of 2012.
Recently Adopted Accounting
Pronouncements
During June 2011, the FASB issued ASU No. 2011-05 which requires an entity to present the components of net income and
the components of other comprehensive income either in a single continuous statement or in two separate but consecutive statements. This pronouncement is effective for fiscal years, and interim periods within those years, beginning after
December 15, 2011. We adopted this ASU beginning January 1, 2012.
We adopted the following accounting standards during 2011, none
of which had a material effect on our consolidated financial position and results of operations:
•
During January 2010, the FASB issued ASU No. 2010-6 to improve the disclosure and transparency of fair value measurements. These amendments
clarify the level of disaggregation required, and the necessary disclosures about the valuation techniques and inputs used to measure fair value for both recurring and nonrecurring fair value measurements. We
Free historical financial statements for Universal Electronics Inc. See how revenue, income, cash flow, and balance sheet financials have changed over 57 quarters since 2012. Compare with UEIC stock chart to see long term trends.
Data imported from Universal Electronics Inc SEC filings. Check original filings before making any investment decision.