Consumer Discretionary › Men'S And Boys' Furnishings, Work Clothing, And Allied Garments

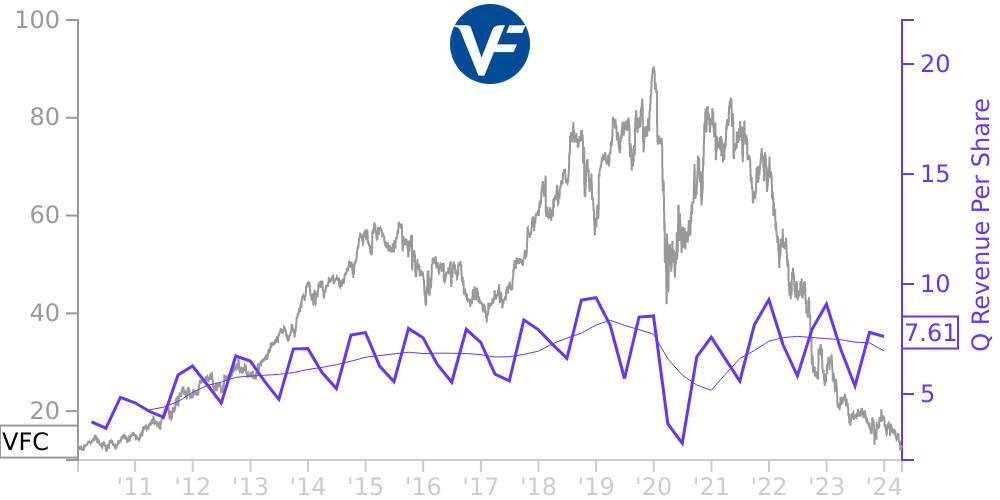
VFC Stock Price Correlated With VF Financials
External Links ⌄
Income Statement
Cash Flow
Balance Sheet
VFC Income Statement
Enable JavaScript and reload
Revenue, Net:
Cost of Goods & Services Sold:
Gross Profit:
Selling, General & Admin Expense:
Research & Development Expense:
Total Operating Expenses:
Operating Income:
Income Taxes:
Net Income:
VFC Cash Flow
Enable JavaScript and reload
Operating Activities Net Income:
Depreciation, Depletion & Amortization:
Change in Accounts Receiveable:
Net Cash from Operations:
Repurchases/Buybacks Common Stock:
Issuance of Long-term Debt:
Cash Dividends Paid:
Net Cash from Financing Activities:
Property, Plant & Equipment Purchases:
Purchases of Businesses, Net of Cash:
Net Cash from Investing Activities:
Net Change in Cash & Equivalents:
VFC Balance Sheet
Enable JavaScript and reload
Cash and Cash Equivalents:
Short-Term Investments:
Accounts Receivable, Net:
Inventories:
Total Current Assets:
Property, Plant & Equipment, Net:
Total Assets:
Accounts Payable:
Current Portion of Long-Term Debt:
Total Short-Term Liabilities:
Long Term Debt, Non-Current Portion:
Total Long-Term Liabilities:
Total Liabilities:
COMPANY PROFILE
BASIS OF PRESENTATION AND SUMMARY OF SIGNIFICANT ACCOUNTING POLICIES Fiscal Year
VF Corporation (together with its subsidiaries, collectively known as “VF” or the “Company”) uses a 52/53 week fiscal year ending on the Saturday closest to March 31 of each year. The Company's current fiscal year runs from April 3, 2022 through April 1, 2023 ("Fiscal 2023"). Accordingly, this Form 10-Q presents our first quarter of Fiscal 2023. For presentation purposes herein, all references to periods ended June 2022 and June 2021 relate to the fiscal periods ended on July 2, 2022 and July 3, 2021, respectively. References to March 2022 relate to information as of April 2, 2022.
Basis of Presentation
On June 28, 2021, VF completed the sale of its Occupational Workwear business. The Occupational Workwear business was comprised primarily of the following brands and businesses: Red Kap ® , VF Solutions ® , Bulwark ® , Workrite ® , Walls ® , Terra ® , Kodiak ® , Work Authority ® and Horace Small ® . The business also included the license of certain Dickies ® occupational workwear products that have historically been sold through the business-to-business channel. The results of the Occupational Workwear business and the related cash flows have been reported as discontinued operations in the Consolidated Statements of Operations and Consolidated Statements of Cash Flows, respectively, through the date of sale. These changes have been applied to all periods presented.
Unless otherwise noted, discussion within these notes to the interim consolidated financial statements relates to continuing operations. Refer to Note 4 for additional information on discontinued operations.
Certain prior year amounts have been reclassified to conform to the Fiscal 2023 presentation.
The accompanying unaudited interim consolidated financial statements have been prepared in accordance with the instructions to Form 10-Q and Rule 10-01 of Regulation S-X and do not include all of the information and notes required by generally accepted accounting principles in the United States of America (“GAAP”) for complete financial statements. Similarly, the March 2022 consolidated balance sheet data was derived from audited financial statements but does not include all disclosures required by GAAP. In the opinion of management, the accompanying unaudited interim consolidated financial statements contain all normal and recurring adjustments necessary to fairly state the consolidated financial position, results of operations and cash flows of VF for the interim periods presented. Operating results for the three months ended June 2022 are not necessarily indicative of results that may be expected for any other interim period or for Fiscal 2023. For
further information, refer to the consolidated financial statements and notes included in VF’s Annual Report on Form 10-K for the year ended April 2, 2022 (“Fiscal 2022 Form 10-K”).
Use of Estimates
In preparing the interim consolidated financial statements, management makes estimates and assumptions that affect amounts reported in the interim consolidated financial statements and accompanying notes. The duration and severity of the coronavirus ("COVID-19") pandemic and the conflict between Russia and Ukraine, and the impact on VF's business is subject to uncertainty; however, the estimates and assumptions made by management include those related to COVID-19 and the Russia-Ukraine conflict based on available information. Actual results may differ from those estimates.
Significant Accounting Policies
Supply Chain Financing Program
During the three months ended June 2022, VF reinstated its voluntary supply chain finance ("SCF") program. The SCF program enables a significant portion of our suppliers of inventory to leverage VF's credit rating to receive payment from participating financial institutions prior to the payment date specified in the terms between VF and the supplier. The SCF program is administered through third-party platf
Free historical financial statements for VF Corp. See how revenue, income, cash flow, and balance sheet financials have changed over 65 quarters since 2010. Compare with VFC stock chart to see long term trends.
Data imported from VF Corp SEC filings. Check original filings before making any investment decision.