Industrials › Electronic Components, Nec

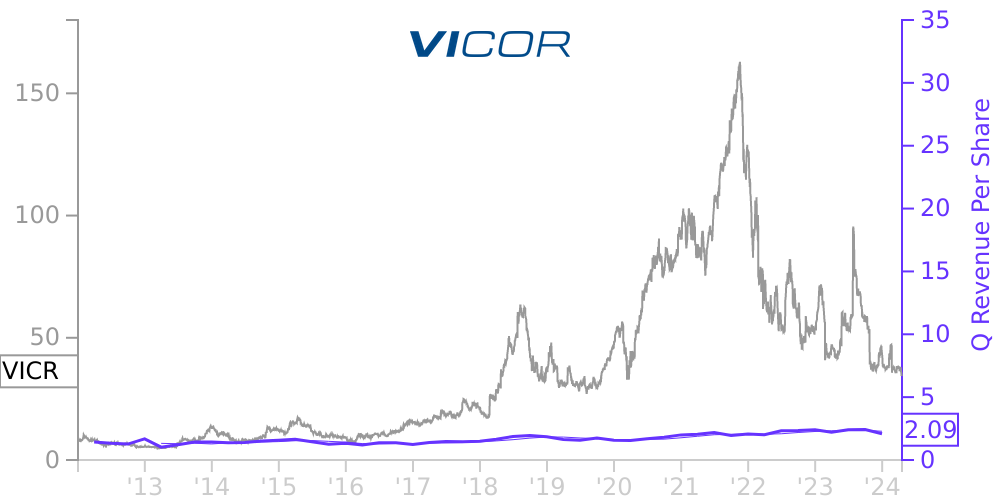
VICR Stock Price Correlated With Vicor Financials
External Links ⌄
Income Statement
Cash Flow
Balance Sheet
VICR Income Statement
Enable JavaScript and reload
Revenue, Net:
Cost of Goods & Services Sold:
Gross Profit:
Selling, General & Admin Expense:
Research & Development Expense:
Total Operating Expenses:
Operating Income:
Income Taxes:
Net Income:
VICR Cash Flow
Enable JavaScript and reload
Operating Activities Net Income:
Depreciation, Depletion & Amortization:
Change in Accounts Receiveable:
Net Cash from Operations:
Repurchases/Buybacks Common Stock:
Issuance of Long-term Debt:
Cash Dividends Paid:
Net Cash from Financing Activities:
Property, Plant & Equipment Purchases:
Purchases of Businesses, Net of Cash:
Net Cash from Investing Activities:
Net Change in Cash & Equivalents:
VICR Balance Sheet
Enable JavaScript and reload
Cash and Cash Equivalents:
Short-Term Investments:
Accounts Receivable, Net:
Inventories:
Total Current Assets:
Property, Plant & Equipment, Net:
Total Assets:
Accounts Payable:
Current Portion of Long-Term Debt:
Total Short-Term Liabilities:
Long Term Debt, Non-Current Portion:
Total Long-Term Liabilities:
Total Liabilities:
COMPANY PROFILE
1. DESCRIPTION OF BUSINESS
Vicor Corporation (the “Company” or “Vicor”) designs, develops, manufactures, and markets modular power components and power systems for converting electrical power. The Company also licenses certain rights to its technology in return for recurring royalties. The principal markets for the Company’s power converters and systems are large original equipment manufacturers (“OEMs”), original design manufacturers (“ODMs”) and their contract manufacturers, and smaller, lower volume users, which are broadly distributed across several major market areas.
Vicor Corporation (the “Company” or “Vicor”) designs, develops, manufactures, and markets modular power components and power systems for converting electrical power. The Company also licenses certain rights to its technology in return for recurring royalties. The principal markets for the Company’s power converters and systems are large original equipment manufacturers (“OEMs”), original design manufacturers (“ODMs”) and their contract manufacturers, and smaller, lower volume users, which are broadly distributed across several major market areas.
Free historical financial statements for Vicor Corp. See how revenue, income, cash flow, and balance sheet financials have changed over 57 quarters since 2012. Compare with VICR stock chart to see long term trends.
Data imported from Vicor Corp SEC filings. Check original filings before making any investment decision.