Industrials › Public Building And Related Furniture

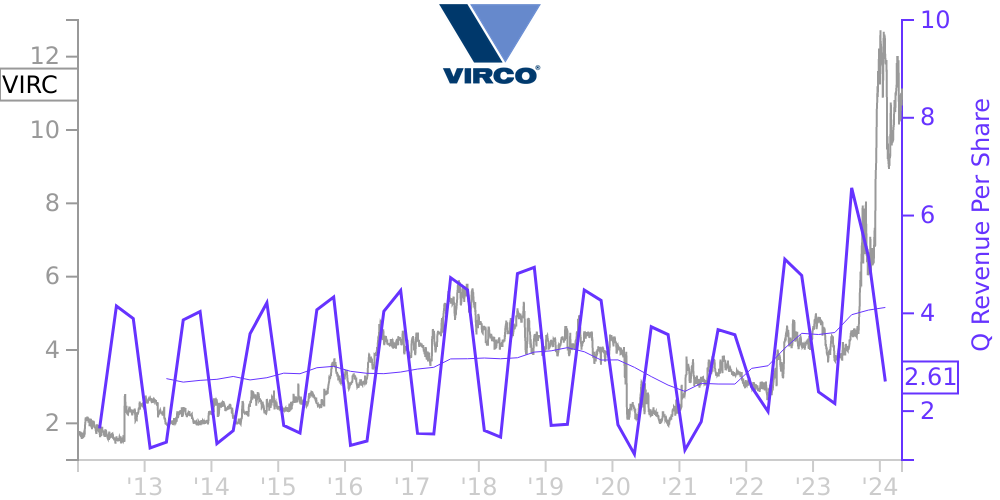
VIRC Stock Price Correlated With Virco Mfg. Financials
External Links ⌄
Income Statement
Cash Flow
Balance Sheet
VIRC Income Statement
Enable JavaScript and reload
Revenue, Net:
Cost of Goods & Services Sold:
Gross Profit:
Selling, General & Admin Expense:
Research & Development Expense:
Total Operating Expenses:
Operating Income:
Income Taxes:
Net Income:
VIRC Cash Flow
Enable JavaScript and reload
Operating Activities Net Income:
Depreciation, Depletion & Amortization:
Change in Accounts Receiveable:
Net Cash from Operations:
Repurchases/Buybacks Common Stock:
Issuance of Long-term Debt:
Cash Dividends Paid:
Net Cash from Financing Activities:
Property, Plant & Equipment Purchases:
Purchases of Businesses, Net of Cash:
Net Cash from Investing Activities:
Net Change in Cash & Equivalents:
VIRC Balance Sheet
Enable JavaScript and reload
Cash and Cash Equivalents:
Short-Term Investments:
Accounts Receivable, Net:
Inventories:
Total Current Assets:
Property, Plant & Equipment, Net:
Total Assets:
Accounts Payable:
Current Portion of Long-Term Debt:
Total Short-Term Liabilities:
Long Term Debt, Non-Current Portion:
Total Long-Term Liabilities:
Total Liabilities:
COMPANY PROFILE
Basis of Presentation The accompanying unaudited condensed consolidated financial statements have been prepared in accordance with accounting principles generally accepted in the United States (U.S. GAAP) for interim financial information and pursuant to the rules and regulations of the Securities and Exchange Commission. Accordingly, they do not include all of the information and notes required by generally accepted accounting principles for complete financial statements and are presented in accordance with the requirements of Form 10-Q and Rule 10-01 of Regulation S-X. These unaudited condensed consolidated financial statements should be read in conjunction with the consolidated financial statements and notes thereto included in the Company’s Annual Report on Form 10-K for the fiscal year ended January 31, 2022 (“Form 10-K”). In the opinion of management, all adjustments considered necessary for a fair presentation have been included. Operating results for the three months ended April 30, 2022 are not necessarily indicative of the results that may be expected for the fiscal year ending January 31, 2023. The balance sheet at January 31, 2022 has been derived from the audited consolidated financial statements at that date, but does not include all of the information and notes required by accounting principles generally accepted in the United States for complete financial statements. All references to the “Company” refer to Virco Mfg. Corporation and its subsidiaries.
Liquidity
The Company expects the impact of supply chain constraints and COVID-19 to continue to be a challenge for the foreseeable future and believes the economy will be adversely impacted for an indeterminate period, including the demand for its products and supply of materials and labor required to manufacture products. The extent of the impact will depend on numerous factors that are unknown, uncertain and cannot be reasonably predicted.
Free historical financial statements for Virco Mfg. Corp.. See how revenue, income, cash flow, and balance sheet financials have changed over 57 quarters since 2012. Compare with VIRC stock chart to see long term trends.
Data imported from Virco Mfg. Corp. SEC filings. Check original filings before making any investment decision.