Industrials › Services-Computer Processing And Data Preparation

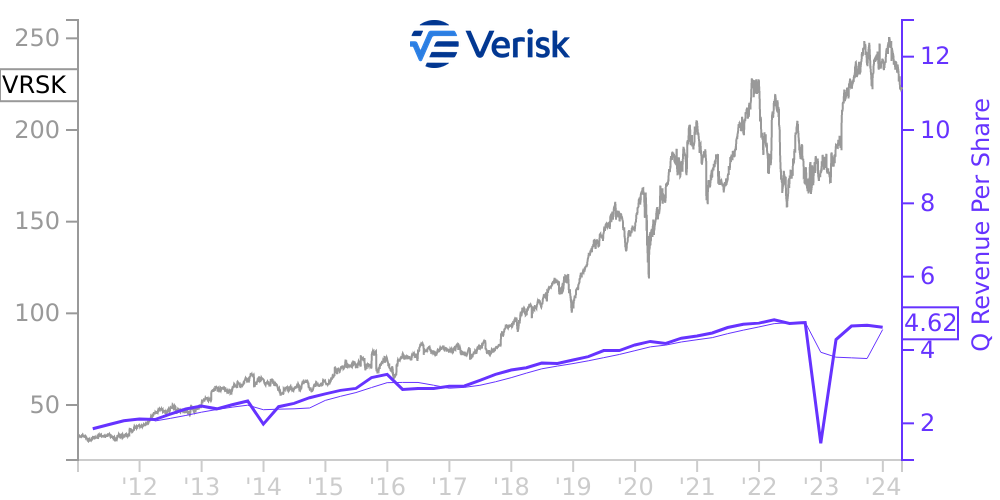
VRSK Stock Price Correlated With Verisk Analytics Financials
External Links ⌄
Income Statement
Cash Flow
Balance Sheet
VRSK Income Statement
Enable JavaScript and reload
Revenue, Net:
Cost of Goods & Services Sold:
Gross Profit:
Selling, General & Admin Expense:
Research & Development Expense:
Total Operating Expenses:
Operating Income:
Income Taxes:
Net Income:
VRSK Cash Flow
Enable JavaScript and reload
Operating Activities Net Income:
Depreciation, Depletion & Amortization:
Change in Accounts Receiveable:
Net Cash from Operations:
Repurchases/Buybacks Common Stock:
Issuance of Long-term Debt:
Cash Dividends Paid:
Net Cash from Financing Activities:
Property, Plant & Equipment Purchases:
Purchases of Businesses, Net of Cash:
Net Cash from Investing Activities:
Net Change in Cash & Equivalents:
VRSK Balance Sheet
Enable JavaScript and reload
Cash and Cash Equivalents:
Short-Term Investments:
Accounts Receivable, Net:
Inventories:
Total Current Assets:
Property, Plant & Equipment, Net:
Total Assets:
Accounts Payable:
Current Portion of Long-Term Debt:
Total Short-Term Liabilities:
Long Term Debt, Non-Current Portion:
Total Long-Term Liabilities:
Total Liabilities:
COMPANY PROFILE
1. Organization:
Verisk Analytics, Inc. is a data analytics provider serving customers in insurance, energy and specialized markets, and financial services. Using various technologies to collect and analyze billions of records, we draw on numerous data assets and domain expertise to provide first -to-market innovations that are integrated into customer workflows. We offer predictive analytics and decision support solutions to customers in rating, underwriting, claims, catastrophe and weather risk, global risk analytics, natural resources intelligence, economic forecasting, commercial banking and finance, and many other fields. Around the world, we help customers protect people, property, and financial assets.
We were established to serve as the parent holding company of Insurance Services Office, Inc. (“ISO”) upon completion of the initial public offering (“IPO”), which occurred on October 9, 2009. ISO was formed in 1971 as an advisory and rating organization for the property and casualty ("P&C") insurance industry to provide statistical and actuarial services, to develop insurance programs, and to assist insurance companies in meeting state regulatory requirements. Over the past decade, we broadened our data assets, entered new markets, placed a greater emphasis on analytics, and pursued strategic acquisitions. We trade under the ticker symbol “VRSK” on the Nasdaq Global Select Market.
Since January 2020, an outbreak of the 2019 novel coronavirus ("COVID- 19") has evolved into a worldwide pandemic. We have modified our operations in line with our business continuity plans due to COVID- 19. While our facilities generally remain open, we are making extensive use of the work-from-home model at this moment. On a daily basis, management is reviewing our operations and there have been to date minimal interruptions in our customer-facing operations. Given the digital nature of our business and the move toward cloud enablement, we expect to remain operationally stable and fully available to our customers. We are in compliance with all financial and non-financial covenants and have not observed a loss of any significant customers, a significant deterioration in the collectability of receivables, a significant reduction in our liquidity, nor a significant decline in subscription renewal rates.
Free historical financial statements for Verisk Analytics Inc. See how revenue, income, cash flow, and balance sheet financials have changed over 61 quarters since 2011. Compare with VRSK stock chart to see long term trends.
Data imported from Verisk Analytics Inc SEC filings. Check original filings before making any investment decision.