Consumer Discretionary › Miscellaneous Products Of Petroleum And Coal

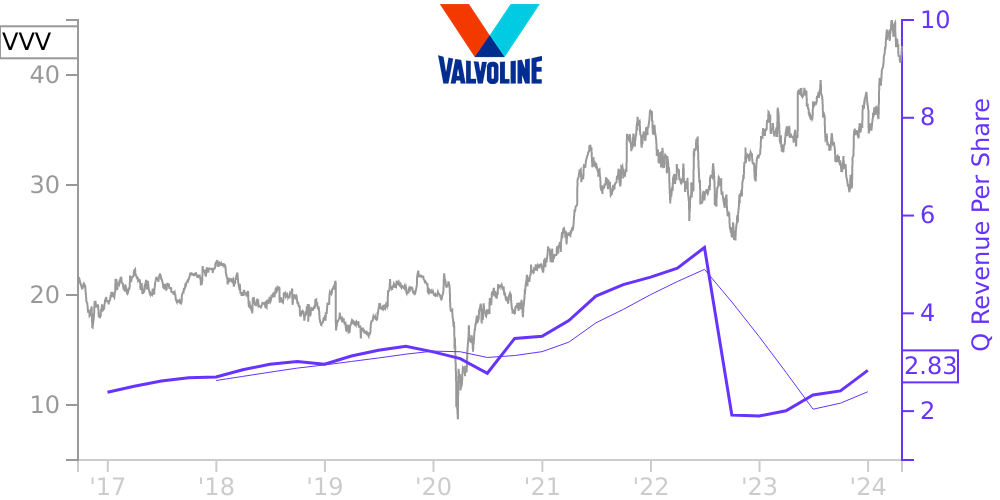
VVV Stock Price Correlated With Valvoline Financials
External Links ⌄
Income Statement
Cash Flow
Balance Sheet
VVV Income Statement
Enable JavaScript and reload
Revenue, Net:
Cost of Goods & Services Sold:
Gross Profit:
Selling, General & Admin Expense:
Research & Development Expense:
Total Operating Expenses:
Operating Income:
Income Taxes:
Net Income:
VVV Cash Flow
Enable JavaScript and reload
Operating Activities Net Income:
Depreciation, Depletion & Amortization:
Change in Accounts Receiveable:
Net Cash from Operations:
Repurchases/Buybacks Common Stock:
Issuance of Long-term Debt:
Cash Dividends Paid:
Net Cash from Financing Activities:
Property, Plant & Equipment Purchases:
Purchases of Businesses, Net of Cash:
Net Cash from Investing Activities:
Net Change in Cash & Equivalents:
VVV Balance Sheet
Enable JavaScript and reload
Cash and Cash Equivalents:
Short-Term Investments:
Accounts Receivable, Net:
Inventories:
Total Current Assets:
Property, Plant & Equipment, Net:
Total Assets:
Accounts Payable:
Current Portion of Long-Term Debt:
Total Short-Term Liabilities:
Long Term Debt, Non-Current Portion:
Total Long-Term Liabilities:
Total Liabilities:
COMPANY PROFILE
DESCRIPTION OF BUSINESS AND BASIS OF PRESENTATION Description of business
Valvoline Inc. (“Valvoline” or the “Company”) is a global vehicle and engine care company that powers the future of mobility through innovative services and products for electric, hybrid, and internal combustion powertrains. Established in 1866, Valvoline’s heritage spans 155 years, during which it has developed recognition across multiple service and product channels. Valvoline's services performed at its retail stores, Valvoline-branded passenger car motor oils, and complementary products are designed to serve evolving maintenance needs and improve vehicle and engine performance and lifespan.
Valvoline operates and franchises approximately 1,600 service center locations and is the second and third largest chain in the United States (“U.S.”) and Canada, respectively, by number of stores. With sales in more than 140 countries and territories, Valvoline’s solutions are available for every engine and powertrain, including high-mileage and heavy-duty applications, and are offered at more than 80,000 locations worldwide.
Basis of presentation and consolidation
The accompanying consolidated financial statements have been prepared in accordance with accounting principles generally accepted in the United States of America (“U.S. GAAP”) and Securities and Exchange Commission (“SEC”) regulations. The financial statements are presented on a consolidated basis for all periods presented and include the operations of the Company and its majority-owned and controlled subsidiaries. All intercompany transactions and balances have been eliminated in consolidation.
Certain prior period amounts have been reclassified in the accompanying consolidated financial statements and notes thereto to conform to the current period presentation.
Free historical financial statements for Valvoline Inc. See how revenue, income, cash flow, and balance sheet financials have changed over 38 quarters since 2016. Compare with VVV stock chart to see long term trends.
Data imported from Valvoline Inc SEC filings. Check original filings before making any investment decision.