Energy › Natural Gas Transmission

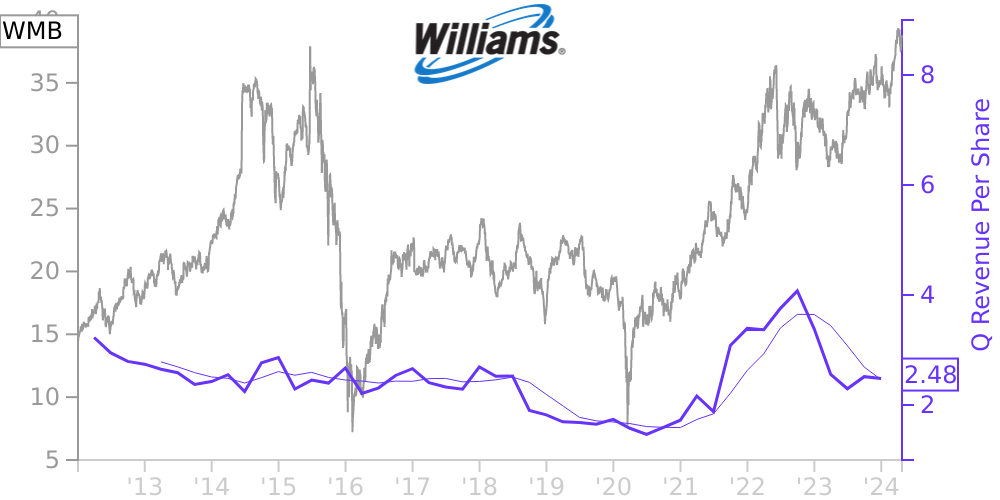
WMB Stock Price Correlated With Williams Cos. Financials
External Links ⌄
Income Statement
Cash Flow
Balance Sheet
WMB Income Statement
Enable JavaScript and reload
Revenue, Net:
Cost of Goods & Services Sold:
Gross Profit:
Selling, General & Admin Expense:
Research & Development Expense:
Total Operating Expenses:
Operating Income:
Income Taxes:
Net Income:
WMB Cash Flow
Enable JavaScript and reload
Operating Activities Net Income:
Depreciation, Depletion & Amortization:
Change in Accounts Receiveable:
Net Cash from Operations:
Repurchases/Buybacks Common Stock:
Issuance of Long-term Debt:
Cash Dividends Paid:
Net Cash from Financing Activities:
Property, Plant & Equipment Purchases:
Purchases of Businesses, Net of Cash:
Net Cash from Investing Activities:
Net Change in Cash & Equivalents:
WMB Balance Sheet
Enable JavaScript and reload
Cash and Cash Equivalents:
Short-Term Investments:
Accounts Receivable, Net:
Inventories:
Total Current Assets:
Property, Plant & Equipment, Net:
Total Assets:
Accounts Payable:
Current Portion of Long-Term Debt:
Total Short-Term Liabilities:
Long Term Debt, Non-Current Portion:
Total Long-Term Liabilities:
Total Liabilities:
COMPANY PROFILE
Note 1 – General, Description of Business, and Basis of Presentation
General
Our accompanying interim consolidated financial statements do not include all the notes in our annual financial statements and, therefore, should be read in conjunction with our consolidated financial statements and notes thereto for the year ended December 31, 2021, in our Annual Report on Form 10-K. The accompanying unaudited financial statements include all normal recurring adjustments and others that, in the opinion of management, are necessary to present fairly our interim financial statements.
The preparation of financial statements in conformity with accounting principles generally accepted in the United States requires management to make estimates and assumptions that affect the amounts reported in our consolidated financial statements and accompanying notes. Actual results could differ from those estimates.
Unless the context clearly indicates otherwise, references in this report to “Williams,” “we,” “our,” “us,” or like terms refer to The Williams Companies, Inc. and its subsidiaries. Unless the context clearly indicates otherwise, references to “Williams,” “we,” “our,” and “us” include the operations in which we own interests accounted for as equity-method investments that are not consolidated in our financial statements. When we refer to our equity investees by name, we are referring exclusively to their businesses and operations.
Description of Business
We are a Delaware corporation whose common stock is listed and traded on the New York Stock Exchange. Our operations are located in the United States. Effective January 1, 2022, following an organizational realignment, our natural gas liquid (NGL) and natural gas marketing services, previously reported within the West segment, along with the former Sequent segment, are now all managed within the Gas & NGL Marketing Services segment. As a result, our operations are presented within the following reportable segments as of March 31, 2022: Transmission & Gulf of Mexico, Northeast G&P, West, and Gas & NGL Marketing Services, consistent with the manner in which our chief operating decision maker evaluates performance and allocates resources. All remaining business activities, including our upstream operations, as well as corporate activities are included in Other. Prior period segment disclosures have been recast for the new segment presentation. Additionally, beginning in 2022 and concurrent with the integration of our legacy gas marketing operations and the marketing operations acquired in the Sequent Acquisition (see Note 3 – Acquisitions), all natural gas marketing revenues from Gas & NGL Marketing Services are presented net of the related costs of those activities in our Consolidated Statement of Income, as subsequent to the integration the entire natural gas marketing portfolio is considered held for trading purposes which requires net presentation .
Transmission & Gulf of Mexico is comprised of our interstate natural gas pipelines, Transcontinental Gas Pipe Line Company, LLC (Transco) and Northwest Pipeline LLC (Northwest Pipeline), as well as natural gas gathering and processing and crude oil production handling and transportation assets in the Gulf Coast region, including a 51 percent interest in Gulfstar One LLC (Gulfstar One) (a consolidated variable interest entity, or VIE), which is a proprietary floating production system, a 50 percent equity-method investment in Gulfstream Natural Gas System, L.L.C. (Gulfstream), and a 60 percent equity-method investment in Discovery Producer Services LLC (Discovery).
Northeast G&P is comprised of our midstream gathering, processing, and fractionation businesses in the Marcellus Shale region primarily in Pennsylvania and New York, and the Utica Shale region of eastern Ohio, as well as a 65 percent interest in Ohio Valley Midstream LLC (Northeast JV) (a consolidated VIE) which operates in West Virginia, Ohio, and Pennsylvania, a 66 percent
Free historical financial statements for Williams Cos. Inc.. See how revenue, income, cash flow, and balance sheet financials have changed over 57 quarters since 2012. Compare with WMB stock chart to see long term trends.
Data imported from Williams Cos. Inc. SEC filings. Check original filings before making any investment decision.