Industrials › Plastics Foam Products

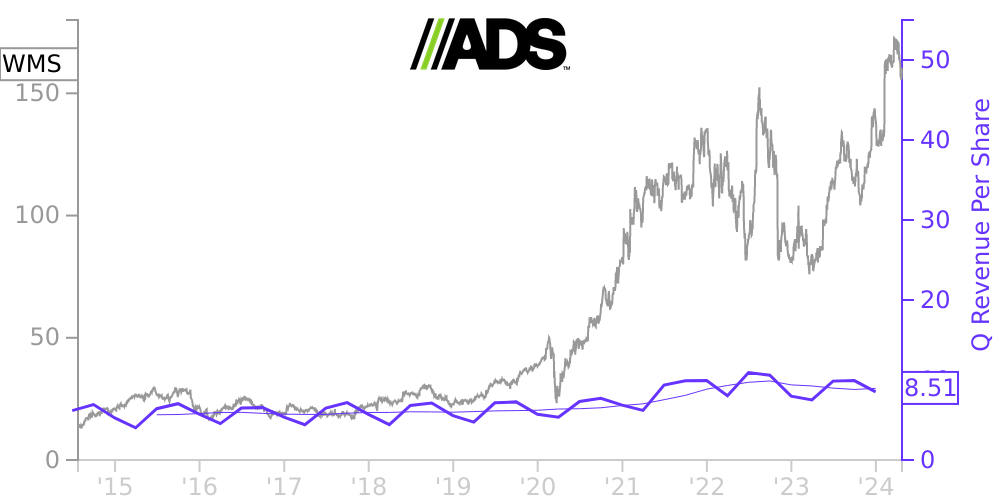
WMS Stock Price Correlated With Advanced Drainage Systems Financials
External Links ⌄
Income Statement
Cash Flow
Balance Sheet
WMS Income Statement
Enable JavaScript and reload
Revenue, Net:
Cost of Goods & Services Sold:
Gross Profit:
Selling, General & Admin Expense:
Research & Development Expense:
Total Operating Expenses:
Operating Income:
Income Taxes:
Net Income:
WMS Cash Flow
Enable JavaScript and reload
Operating Activities Net Income:
Depreciation, Depletion & Amortization:
Change in Accounts Receiveable:
Net Cash from Operations:
Repurchases/Buybacks Common Stock:
Issuance of Long-term Debt:
Cash Dividends Paid:
Net Cash from Financing Activities:
Property, Plant & Equipment Purchases:
Purchases of Businesses, Net of Cash:
Net Cash from Investing Activities:
Net Change in Cash & Equivalents:
WMS Balance Sheet
Enable JavaScript and reload
Cash and Cash Equivalents:
Short-Term Investments:
Accounts Receivable, Net:
Inventories:
Total Current Assets:
Property, Plant & Equipment, Net:
Total Assets:
Accounts Payable:
Current Portion of Long-Term Debt:
Total Short-Term Liabilities:
Long Term Debt, Non-Current Portion:
Total Long-Term Liabilities:
Total Liabilities:
COMPANY PROFILE
1.
BASIS OF PRESENTATION AND BUSINESS OVERVIEW
The accompanying unaudited interim Condensed Consolidated
Financial Statements of WMS Industries Inc. (“WMS”,
“we”, “us” or “the Company”)
have been prepared pursuant to the rules and regulations of the
Securities and Exchange Commission (the “SEC”) for
quarterly reports on Form 10-Q and do not include all of the
information and note disclosures required by U.S. generally
accepted accounting principles (“U.S. GAAP”) for
complete financial statements. The accompanying Condensed
Consolidated Financial Statements should therefore be read in
conjunction with the Consolidated Financial Statements and Notes
thereto for the fiscal year ended June 30, 2010 included in
our Annual Report on Form 10-K filed with the SEC on
August 26, 2010. The accompanying unaudited interim Condensed
Consolidated Financial Statements have been prepared in accordance
with U.S. generally accepted accounting principles and reflect all
adjustments of a normal, recurring nature that are, in the opinion
of management, necessary for a fair presentation of results for
these interim periods.
Sales of our gaming machines to casinos are generally strongest
in the spring and slowest in the summer months, while gaming
operations revenues are generally strongest in the spring and
summer. Typically our total revenues are lowest in the September
quarter and build in each subsequent quarter with the June quarter
generating our highest total quarterly revenues. In addition,
quarterly revenues and net income may increase when we receive a
larger number of approvals for new games from regulators than in
other quarters, when a game or platform that achieves significant
player appeal is introduced, if a significant number of new casinos
open or existing casinos expand or if gaming is permitted in a
significant new jurisdiction. Operating results for the three
months ended September 30, 2010 are not necessarily indicative
of the results that may be expected for the fiscal year ended
June 30, 2011. For further information refer to our
Consolidated Financial Statements and Notes thereto included in our
Annual Report on Form 10-K for the fiscal year ended June 30,
2010.
We are engaged in one business segment: to serve the legalized
gaming industry by designing, manufacturing and distributing games,
video and mechanical reel-spinning gaming machines and video
lottery terminals (“VLTs”) to authorized customers in
legal gaming venues worldwide. We have a production facility in the
United States with development and distribution offices located in
the United States, Argentina, Australia, Austria, Canada, China,
India, Mexico, the Netherlands, South Africa, Spain and the United
Kingdom.
We market our gaming machines in two principal ways. First,
product sales include the sale to casinos and other gaming machine
operators of new and used gaming machines and VLTs, conversion kits
(including game, hardware or operating system conversions), parts,
amusement-with-prize gaming machines and gaming related systems for
smaller international casino operators. Second, we license our game
content and intellectual property to third parties for distribution
and we lease gaming machines and VLTs to casinos and other licensed
gaming machine operators for payments based upon (1) a
percentage of the amount wagered, called “coin in” or a
combination of a fixed daily fee and a percentage of the amount
wagered, (2) a percentage of the net win, which is the
earnings generated by casino patrons playing the gaming machine, or
(3) fixed daily fees. The installed base of our participation
gaming machines consists of: wide-area progressive
(“WAP”) participation gaming machines; local-area
progressive (“LAP”) participation gaming machines; and
stand-alone participation gaming machines. We also enter into
leases for casino-owned daily fee games and gaming machine, VLT and
other leases. We refer to WAP, LAP and stand-alone participation
gaming machines as “participa
Free historical financial statements for Advanced Drainage Systems Inc. See how revenue, income, cash flow, and balance sheet financials have changed over 60 quarters since 2010. Compare with WMS stock chart to see long term trends.
Data imported from Advanced Drainage Systems Inc SEC filings. Check original filings before making any investment decision.