Industrials › Services-Miscellaneous Equipment Rental And Leasing

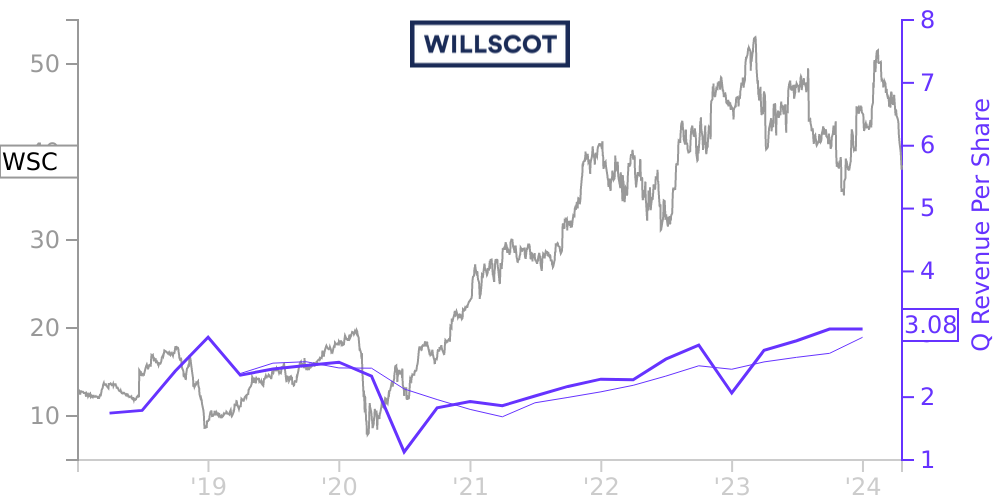
WSC Stock Price Correlated With WillScot Mobile Mini Holdings Financials
External Links ⌄
Income Statement
Cash Flow
Balance Sheet
WSC Income Statement
Enable JavaScript and reload
Revenue, Net:
Cost of Goods & Services Sold:
Gross Profit:
Selling, General & Admin Expense:
Research & Development Expense:
Total Operating Expenses:
Operating Income:
Income Taxes:
Net Income:
WSC Cash Flow
Enable JavaScript and reload
Operating Activities Net Income:
Depreciation, Depletion & Amortization:
Change in Accounts Receiveable:
Net Cash from Operations:
Repurchases/Buybacks Common Stock:
Issuance of Long-term Debt:
Cash Dividends Paid:
Net Cash from Financing Activities:
Property, Plant & Equipment Purchases:
Purchases of Businesses, Net of Cash:
Net Cash from Investing Activities:
Net Change in Cash & Equivalents:
WSC Balance Sheet
Enable JavaScript and reload
Cash and Cash Equivalents:
Short-Term Investments:
Accounts Receivable, Net:
Inventories:
Total Current Assets:
Property, Plant & Equipment, Net:
Total Assets:
Accounts Payable:
Current Portion of Long-Term Debt:
Total Short-Term Liabilities:
Long Term Debt, Non-Current Portion:
Total Long-Term Liabilities:
Total Liabilities:
COMPANY PROFILE
Summary of Significant Accounting Policies Organization and Nature of Operations
WillScot Mobile Mini Holdings Corp. (“WillScot Mobile Mini” and, together with its subsidiaries, the “Company”) is a leading business services provider specializing in innovative flexible work space and portable storage solutions in the United States (“US”), Canada, Mexico and the United Kingdom ("UK"). The Company also maintains a fleet of specialty containment products, including liquid and solid containment solutions. The Company leases, sells, delivers and installs mobile solutions and storage products through an integrated network of branch locations that spans North America and the UK.
Basis of Presentation and Principles of Consolidation
The accompanying unaudited condensed consolidated financial statements have been prepared in accordance with the instructions to Form 10-Q and do not include all the information and notes required by US Generally Accepted Accounting Principles ("GAAP") for complete financial statements. The accompanying unaudited condensed consolidated financial statements comprise the financial statements of WillScot Mobile Mini and its subsidiaries that it controls due to ownership of a majority voting interest and contain all adjustments, which are of a normal and recurring nature, considered necessary by management to present fairly the financial position, results of operations and cash flows for the interim periods presented.
Subsidiaries are fully consolidated from the dat e of acquisition, being the date on which the Company obtains control, and continue to be consolidated until the date when such control ceases. The financial statements of the subsidiaries are prepared for the same reporting period as the Company. All intercompany balances and transactions are eliminated.
The results of operations for the three months ended March 31, 2022 are not necessarily indicative of the results to be expected for the full year. For further information, refer to the consolidated financial statements and notes included in the Company's Annual Report on Form 10-K for the year ended December 31, 2021.
Reclassifications
Certain reclassifications have been made to prior year financial statements to conform to the current year presentation.
Recently Issued Accounting Standards
In March 2020, the Financial Accounting Standards Board ("FASB") issued Accounting Standards Update ("ASU") 2020-04, Reference Rate Reform (Topic 848): Facilitation of the Effects of Reference Rate Reform on Financial Reporting. This update was intended to ease the potential burden in accounting for and recognizing the effects of reference rate reform. It provided optional practical expedients and exceptions for applying U.S. GAAP to contracts, hedging relationships, and other transactions affected by reference rate reform, if certain criteria are met. This update became effective on March 12, 2020 and is available for use through December 31, 2022. The Company is currently evaluating the impact of reference rate reform and the potential impact of adoption of these elective practical expedients on its condensed consolidated financial statements and does not expect the impact to be material.
In October 2021, the FASB issued ASU 2021-08, Business Combinations (Topic 805): Accounting for Contract Assets and Contract Liabilities from Contracts with Customers ("ASU 2021-08"). ASU 2021-08 requires that an acquirer recognize and measure contract assets and liabilities acquired in a business combination in accordance with ASU 2014-09, Revenue from Contracts with Customers (Topic 606) ("ASC 606"). ASU 2021-08 is effective for annual periods beginning after December 15, 2022, including interim periods therein, with early adoption permitted. The guidance will be applied prospectively to acquisitions occurring on or after the effective date. The Company will continue to evaluate the impact of this guidance, which will depend on the contract assets and liabilitie
Free historical financial statements for WillScot Mobile Mini Holdings Corp.. See how revenue, income, cash flow, and balance sheet financials have changed over 39 quarters since 2015. Compare with WSC stock chart to see long term trends.
Data imported from WillScot Mobile Mini Holdings Corp. SEC filings. Check original filings before making any investment decision.