Consumer Discretionary › Retail-Home Furniture, Furnishings And Equipment Stores

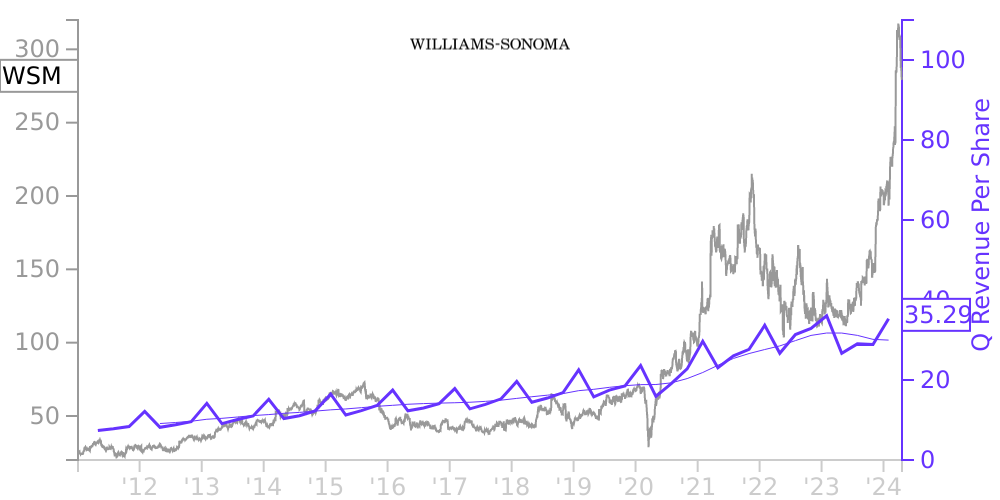
WSM Stock Price Correlated With Williams-Sonoma Financials
External Links ⌄
Income Statement
Cash Flow
Balance Sheet
WSM Income Statement
Enable JavaScript and reload
Revenue, Net:
Cost of Goods & Services Sold:
Gross Profit:
Selling, General & Admin Expense:
Research & Development Expense:
Total Operating Expenses:
Operating Income:
Income Taxes:
Net Income:
WSM Cash Flow
Enable JavaScript and reload
Operating Activities Net Income:
Depreciation, Depletion & Amortization:
Change in Accounts Receiveable:
Net Cash from Operations:
Repurchases/Buybacks Common Stock:
Issuance of Long-term Debt:
Cash Dividends Paid:
Net Cash from Financing Activities:
Property, Plant & Equipment Purchases:
Purchases of Businesses, Net of Cash:
Net Cash from Investing Activities:
Net Change in Cash & Equivalents:
WSM Balance Sheet
Enable JavaScript and reload
Cash and Cash Equivalents:
Short-Term Investments:
Accounts Receivable, Net:
Inventories:
Total Current Assets:
Property, Plant & Equipment, Net:
Total Assets:
Accounts Payable:
Current Portion of Long-Term Debt:
Total Short-Term Liabilities:
Long Term Debt, Non-Current Portion:
Total Long-Term Liabilities:
Total Liabilities:
COMPANY PROFILE
FINANCIAL STATEMENTS - BASIS OF PRESENTATION These financial statements include Williams-Sonoma, Inc. and its wholly owned subsidiaries (“we,” “us” or “our”). The Condensed Consolidated Balance Sheets as of May 1, 2022 and May 2, 2021, the Condensed Consolidated Statements of Earnings, the Condensed Consolidated Statements of Comprehensive Income, the Condensed Consolidated Statements of Stockholders’ Equity and the Condensed Consolidated Statements of Cash Flows for the thirteen weeks then ended, have been prepared by us, and have not been audited. In our opinion, the financial statements include all adjustments (which include only normal recurring adjustments) necessary to present fairly the financial position at the balance sheet dates and the results of operations for the thirteen weeks then ended. Intercompany transactions and accounts have been eliminated in our consolidation. The balance sheet as of January 31, 2021, presented herein, has been derived from our audited Consolidated Balance Sheet included in our Annual Report on Form 10-K for the fiscal year ended January 31, 2021.
The results of operations for the thirteen weeks ended May 1, 2022 are not necessarily indicative of the operating results of the full year.
Certain information and footnote disclosures normally included in the annual financial statements prepared in accordance with accounting principles generally accepted in the United States of America (“U.S. GAAP”) have been omitted. These financial statements should be read in conjunction with the Consolidated Financial Statements and notes thereto included in our Annual Report on Form 10-K for the fiscal year ended January 30, 2022.
During fiscal 2021 and continuing into the first quarter of fiscal 2022, global supply chain disruptions, including COVID-19 related factory closures and increased port congestion, caused delays in inventory receipts, increased raw material costs, and higher shipping-related charges. We expect these supply chain challenges to continue into the remainder of fiscal 2022, which could negatively impact our business.
New Accounting Pronouncements
In March 2020, the FASB issued ASU 2020-04, Reference Rate Reform (Topic 848). The ASU is intended to ease the potential accounting and financial reporting burden of reference rate reform, including the expected market transition from the London Interbank Offered Rate (LIBOR) and other interbank offered rates to alternative reference rates. The guidance provides optional expedients and scope exceptions for transactions if certain criteria are met. These transactions include contract modifications, hedge accounting, and the sale or transfer of debt securities classified as held-to-maturity. We may elect to apply the provisions of the new standard prospectively through December 31, 2022. Unlike other topics, the provisions of this update are only available until December 31, 2022, by which time the reference rate replacement activity is expected to be completed. We have yet to elect an adoption date, but do not believe the adoption would have a material impact on our financial condition, results of operations or cash flows.
Free historical financial statements for Williams-Sonoma Inc.. See how revenue, income, cash flow, and balance sheet financials have changed over 61 quarters since 2011. Compare with WSM stock chart to see long term trends.
Data imported from Williams-Sonoma Inc. SEC filings. Check original filings before making any investment decision.