Industrials › Electrical Industrial Apparatus

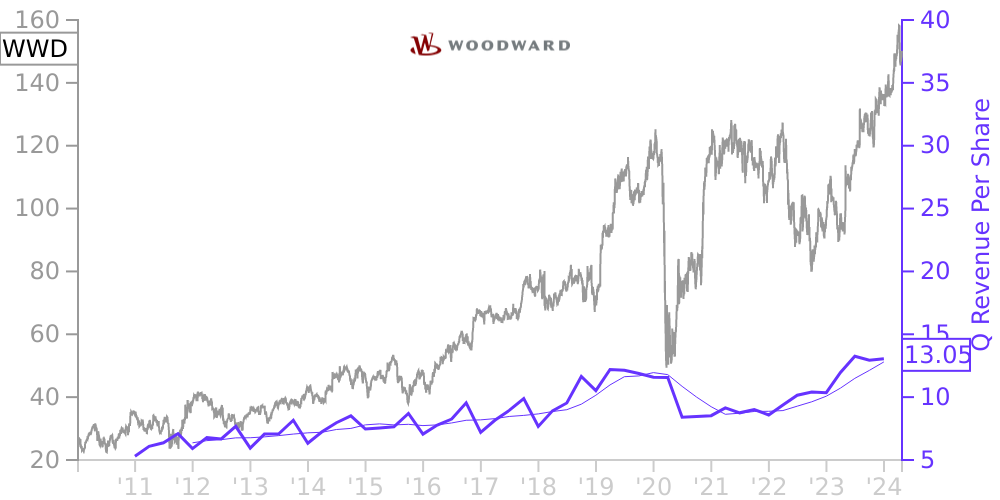
WWD Stock Price Correlated With Woodward Financials
External Links ⌄
Income Statement
Cash Flow
Balance Sheet
WWD Income Statement
Enable JavaScript and reload
Revenue, Net:
Cost of Goods & Services Sold:
Gross Profit:
Selling, General & Admin Expense:
Research & Development Expense:
Total Operating Expenses:
Operating Income:
Income Taxes:
Net Income:
WWD Cash Flow
Enable JavaScript and reload
Operating Activities Net Income:
Depreciation, Depletion & Amortization:
Change in Accounts Receiveable:
Net Cash from Operations:
Repurchases/Buybacks Common Stock:
Issuance of Long-term Debt:
Cash Dividends Paid:
Net Cash from Financing Activities:
Property, Plant & Equipment Purchases:
Purchases of Businesses, Net of Cash:
Net Cash from Investing Activities:
Net Change in Cash & Equivalents:
WWD Balance Sheet
Enable JavaScript and reload
Cash and Cash Equivalents:
Short-Term Investments:
Accounts Receivable, Net:
Inventories:
Total Current Assets:
Property, Plant & Equipment, Net:
Total Assets:
Accounts Payable:
Current Portion of Long-Term Debt:
Total Short-Term Liabilities:
Long Term Debt, Non-Current Portion:
Total Long-Term Liabilities:
Total Liabilities:
COMPANY PROFILE
Note 1. Basis of presentation
The Condensed Consolidated Financial Statements of Woodward, Inc. (“Woodward” or the “Company”) as of March 31, 2022 and for the three and six-months ended March 31, 2022 and 2021, included herein, have not been audited by an independent registered public accounting firm. These unaudited Condensed Consolidated Financial Statements reflect all normal recurring adjustments that, in the opinion of management, are necessary to present fairly Woodward’s financial position as of March 31, 2022, and the statements of earnings, comprehensive earnings, cash flows, and changes in stockholders’ equity for the periods presented herein. The results of operations for the three and six-months ended March 31, 2022 and 2021 are not necessarily indicative of the operating results to be expected for other interim periods or for the full fiscal year. Dollar and share amounts contained in these unaudited Condensed Consolidated Financial Statements are in thousands, except per share amounts, unless otherwise noted.
The unaudited Condensed Consolidated Financial Statements included herein have been prepared pursuant to the rules and regulations of the Securities and Exchange Commission (“SEC”) for interim reporting. Certain information and footnote disclosures normally included in financial statements prepared in accordance with accounting principles generally accepted in the United States of America (“U.S. GAAP”) have been condensed or omitted pursuant to such rules and regulations. Accordingly, these unaudited Condensed Consolidated Financial Statements should be read in conjunction with the audited Consolidated Financial Statements and Notes thereto included in Woodward’s most recent Annual Report on Form 10-K filed with the SEC and other financial information filed with the SEC.
Management is required to use estimates and assumptions that affect the reported amounts of assets and liabilities at the date of the financial statements, the reported revenues and expenses recognized during the reporting period, and certain financial statement disclosures, in the preparation of the unaudited Condensed Consolidated Financial Statements included herein. Significant estimates in these unaudited Condensed Consolidated Financial Statements include allowances for credit losses; net realizable value of inventories; variable consideration including customer rebates earned and payable and early payment discounts; warranty reserves; useful lives of property and identifiable intangible assets; the evaluation of impairments of property, intangible assets, and goodwill; the provision for income tax and related valuation reserves; the valuation of derivative instruments; assumptions used in the determination of the funded status and annual expense of pension and postretirement employee benefit plans; the valuation of stock compensation instruments granted to employees, board members and any other eligible recipients; estimates of incremental borrowing rates used when estimating the present value of future lease payments; assumptions used when including renewal options or non-exercise of termination options in lease terms; estimates of total lifetime sales used in the recognition of revenue of deferred material rights and balance sheet classification of the related contract liability; estimates of total sales contract costs when recognizing revenue under the cost-to-cost method; and contingencies. Actual results could vary from Woodward’s estimates.
COVID-19 Pandemic
When combined with the various measures enacted by governments and private organizations to contain COVID-19 or slow its spread, the pandemic has adversely impacted global economic activity and contributed to volatility in financial markets; and the Company has likewise been significantly impacted by the global COVID-19 pandemic. The ongoing COVID-19 pandemic could continue to have a material adverse impact on economic and market conditions and presents uncertainty
Free historical financial statements for Woodward Inc. See how revenue, income, cash flow, and balance sheet financials have changed over 62 quarters since 2010. Compare with WWD stock chart to see long term trends.
Data imported from Woodward Inc SEC filings. Check original filings before making any investment decision.