Technology › General Industrial Machinery And Equipment

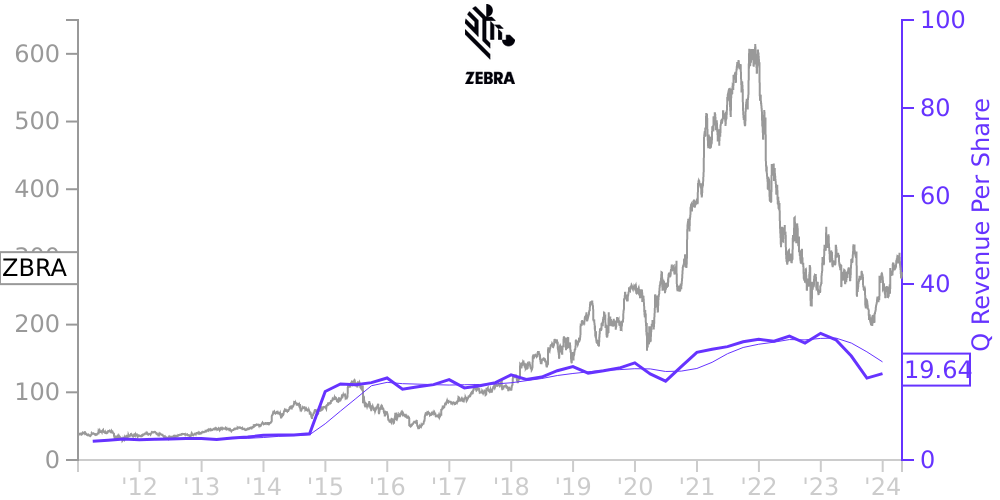
ZBRA Stock Price Correlated With Zebra Technologies Financials
External Links ⌄
Income Statement
Cash Flow
Balance Sheet
ZBRA Income Statement
Enable JavaScript and reload
Revenue, Net:
Cost of Goods & Services Sold:
Gross Profit:
Selling, General & Admin Expense:
Research & Development Expense:
Total Operating Expenses:
Operating Income:
Income Taxes:
Net Income:
ZBRA Cash Flow
Enable JavaScript and reload
Operating Activities Net Income:
Depreciation, Depletion & Amortization:
Change in Accounts Receiveable:
Net Cash from Operations:
Repurchases/Buybacks Common Stock:
Issuance of Long-term Debt:
Cash Dividends Paid:
Net Cash from Financing Activities:
Property, Plant & Equipment Purchases:
Purchases of Businesses, Net of Cash:
Net Cash from Investing Activities:
Net Change in Cash & Equivalents:
ZBRA Balance Sheet
Enable JavaScript and reload
Cash and Cash Equivalents:
Short-Term Investments:
Accounts Receivable, Net:
Inventories:
Total Current Assets:
Property, Plant & Equipment, Net:
Total Assets:
Accounts Payable:
Current Portion of Long-Term Debt:
Total Short-Term Liabilities:
Long Term Debt, Non-Current Portion:
Total Long-Term Liabilities:
Total Liabilities:
COMPANY PROFILE
Description of Business and Basis of Presentation Zebra Technologies Corporation and its subsidiaries (“Zebra” or the “Company”) is a global leader providing innovative Enterprise Asset Intelligence (“EAI”) solutions in the automatic identification and data capture solutions industry. We design, manufacture, and sell a broad range of products and solutions, including cloud-based subscriptions, that capture and move data. We also provide a full range of services, including maintenance, technical support, repair, managed and professional services. End-users of our products, solutions and services include those in retail and e-commerce, manufacturing, transportation and logistics, healthcare, public sector, and other industries around the world. We provide our products, solutions and services globally through a direct sales force and an extensive network of channel partners.
Effective January 1, 2021, the retail solutions product line, which provides a range of physical inventory management solutions with application in the retail industry, including solutions for full store physical inventories, cycle counts and analytics, moved from our Asset Intelligence & Tracking (“AIT”) segment into our Enterprise Visibility & Mobility (“EVM”) segment contemporaneous with a change in our organizational structure and management of the business. Prior period results have been reclassified to conform to the current period’s presentation. This change did not have an impact on the Consolidated Financial Statements. See Note 20, Segment Information & Geographic Data for additional information related to each segment’s results.
Effective January 1, 2021, the retail solutions product line, which provides a range of physical inventory management solutions with application in the retail industry, including solutions for full store physical inventories, cycle counts and analytics, moved from our Asset Intelligence & Tracking (“AIT”) segment into our Enterprise Visibility & Mobility (“EVM”) segment contemporaneous with a change in our organizational structure and management of the business. Prior period results have been reclassified to conform to the current period’s presentation. This change did not have an impact on the Consolidated Financial Statements. See Note 20, Segment Information & Geographic Data for additional information related to each segment’s results.
Free historical financial statements for Zebra Technologies Corp. See how revenue, income, cash flow, and balance sheet financials have changed over 61 quarters since 2011. Compare with ZBRA stock chart to see long term trends.
Data imported from Zebra Technologies Corp SEC filings. Check original filings before making any investment decision.