Technology › Services-Computer Programming, Data Processing, Etc.

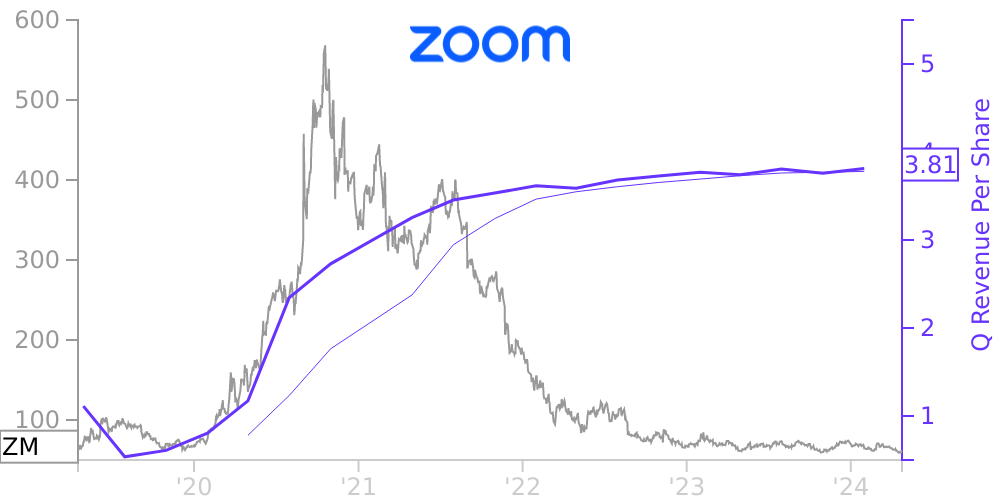
ZM Stock Price Correlated With Zoom Video Communications Financials
External Links ⌄
Income Statement
Cash Flow
Balance Sheet
ZM Income Statement
Enable JavaScript and reload
Revenue, Net:
Cost of Goods & Services Sold:
Gross Profit:
Selling, General & Admin Expense:
Research & Development Expense:
Total Operating Expenses:
Operating Income:
Income Taxes:
Net Income:
ZM Cash Flow
Enable JavaScript and reload
Operating Activities Net Income:
Depreciation, Depletion & Amortization:
Change in Accounts Receiveable:
Net Cash from Operations:
Repurchases/Buybacks Common Stock:
Issuance of Long-term Debt:
Cash Dividends Paid:
Net Cash from Financing Activities:
Property, Plant & Equipment Purchases:
Purchases of Businesses, Net of Cash:
Net Cash from Investing Activities:
Net Change in Cash & Equivalents:
ZM Balance Sheet
Enable JavaScript and reload
Cash and Cash Equivalents:
Short-Term Investments:
Accounts Receivable, Net:
Inventories:
Total Current Assets:
Property, Plant & Equipment, Net:
Total Assets:
Accounts Payable:
Current Portion of Long-Term Debt:
Total Short-Term Liabilities:
Long Term Debt, Non-Current Portion:
Total Long-Term Liabilities:
Total Liabilities:
COMPANY PROFILE
Summary of Business and Significant Accounting Policies Description of Business
Zoom Video Communications, Inc. and its subsidiaries (collectively, “Zoom,” the “Company,” “we,” “us,” or “our”) connect people through our core unified communications offering, which frictionlessly brings together video, phone, chat, and webinars, and enables meaningful experiences across disparate devices and locations. We were incorporated in the state of Delaware in April 2011, and are headquartered in San Jose, California.
Fiscal Year
Our fiscal year ends on January 31. References to fiscal year 2022, for example, refer to the fiscal year ended January 31, 2022.
Basis of Presentation
The accompanying consolidated financial statements have been prepared in accordance with generally accepted accounting principles in the United States of America (“GAAP”) and include the accounts of Zoom Video Communications, Inc., its subsidiaries, and a variable interest entity for which we are the primary beneficiary. All intercompany balances and transactions have been eliminated in consolidation.
Use of Estimates
The preparation of consolidated financial statements in conformity with GAAP requires management to make estimates and assumptions that affect the reported amounts of assets and liabilities, disclosure of contingent assets and liabilities at the date of the consolidated financial statements, and the reported amounts of revenue and expenses during the reporting period. Significant items subject to such estimates and assumptions include, but are not limited to, the estimated expected benefit period for deferred contract acquisition costs, the useful lives of long-lived assets, the incremental borrowing rate for operating leases, stock-based compensation expense, sales and other tax liabilities, the fair value of marketable securities, acquired intangible assets and goodwill, the valuation of deferred income tax assets and uncertain tax positions, and accruals and contingencies. Actual results could materially differ from those estimates.
The COVID-19 pandemic has created, and may continue to create, significant uncertainty in macroeconomic conditions, and the extent of its impact on our operational and financial performance will depend on certain developments, including the duration and spread of the outbreak, the availability and distribution of vaccines, and their impact on our customers and our sales cycles. During the fiscal years ended January 31, 2022 and 2021, our estimates and assumptions required increased judgment and carried a higher degree of variability and volatility. As events continue to evolve and additional information becomes available, our estimates may change materially in future periods.
Concentration of Risks
Our financial instruments that are exposed to concentrations of credit risk consist primarily of cash and cash equivalents, marketable securities, restricted cash, and accounts receivable. We maintain our cash, cash equivalents, marketable securities, and restricted cash with high-quality financial institutions with investment-grade ratings. A majority of the cash balances are with U.S. banks and are insured to the extent defined by the Federal Deposit Insurance Corporation.
No single customer accounted for more than 10% of accounts receivable at January 31, 2022 or 2021. No single customer accounted for 10% or more of total revenue during the fiscal years ended January 31, 2022, 2021, or 2020.
Cash, Cash Equivalents, and Restricted Cash
Cash and cash equivalents consist of cash in banks and highly liquid investments, primarily money market funds, purchased with an original maturity of three months or less.
Restricted cash consists of certificates of deposit collateralizing our operating leases and cash from proceeds from international employees’ sales of our common stock, and is included in prepaid expenses and other current assets and other assets, noncurrent in the consolidated balance sheets.
As of January
Free historical financial statements for Zoom Video Communications Inc.. See how revenue, income, cash flow, and balance sheet financials have changed over 28 quarters since 2019. Compare with ZM stock chart to see long term trends.
Data imported from Zoom Video Communications Inc. SEC filings. Check original filings before making any investment decision.