
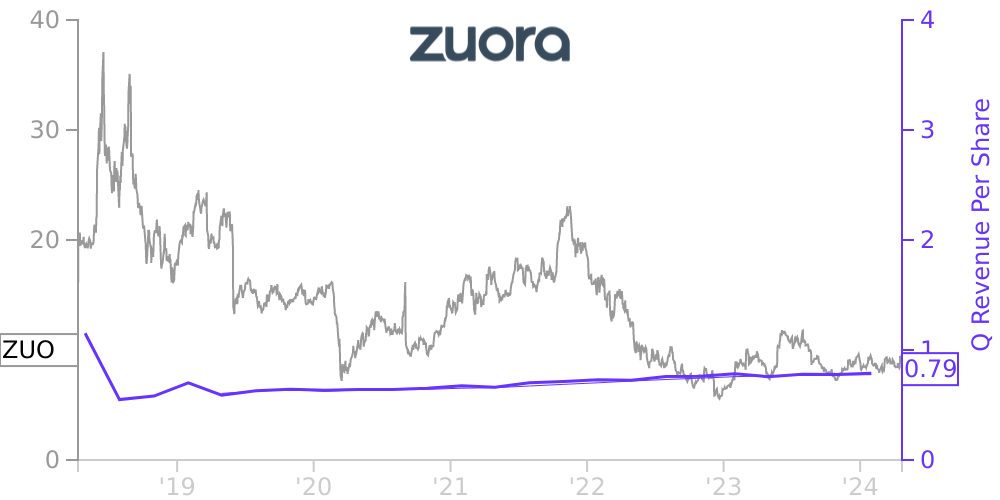
ZUO Stock Price Correlated With Zuora Financials
External Links ⌄
Income Statement
Cash Flow
Balance Sheet
ZUO Income Statement
Enable JavaScript and reload
Revenue, Net:
Cost of Goods & Services Sold:
Gross Profit:
Selling, General & Admin Expense:
Research & Development Expense:
Total Operating Expenses:
Operating Income:
Income Taxes:
Net Income:
ZUO Cash Flow
Enable JavaScript and reload
Operating Activities Net Income:
Depreciation, Depletion & Amortization:
Change in Accounts Receiveable:
Net Cash from Operations:
Repurchases/Buybacks Common Stock:
Issuance of Long-term Debt:
Cash Dividends Paid:
Net Cash from Financing Activities:
Property, Plant & Equipment Purchases:
Purchases of Businesses, Net of Cash:
Net Cash from Investing Activities:
Net Change in Cash & Equivalents:
ZUO Balance Sheet
Enable JavaScript and reload
Cash and Cash Equivalents:
Short-Term Investments:
Accounts Receivable, Net:
Inventories:
Total Current Assets:
Property, Plant & Equipment, Net:
Total Assets:
Accounts Payable:
Current Portion of Long-Term Debt:
Total Short-Term Liabilities:
Long Term Debt, Non-Current Portion:
Total Long-Term Liabilities:
Total Liabilities:
COMPANY PROFILE
Note 1. Overview and Basis of Presentation
Description of Business
Zuora, Inc. was incorporated in the state of Delaware in 2006 and began operations in 2007. Zuora ’ s fiscal year ends on January 31. Zuora is headquartered in Redwood City, California.
Zuora provides a cloud-based subscription management platform, built to help companies monetize new services and operate dynamic, recurring revenue business models. Our solution enables companies across multiple industries and geographies to launch, manage and scale a subscription business, automating the entire quote-to-revenue process, including quoting, billing, collections and revenue recognition. With Zuora’s solution, businesses can change pricing and packaging for products and services to grow and scale, efficiently comply with revenue recognition standards, analyze customer data to optimize their subscription offerings, and build meaningful relationships with their subscribers.
References to "Zuora”, "us”, “our”, or “we” in these notes refer to Zuora, Inc. and its subsidiaries on a consolidated basis.
Basis of Presentation and Principles of Consolidation
The accompanying consolidated financial statements, which include the accounts of Zuora and its wholly owned subsidiaries, have been prepared in conformity with accounting principles generally accepted in the United States of America (GAAP). All intercompany balances and transactions have been eliminated in consolidation.
Use of Estimates
The preparation of consolidated financial statements in conformity with GAAP requires management to make certain estimates and assumptions. These estimates and assumptions affect the reported amounts of assets and liabilities at the date of the consolidated financial statements, as well as reported amounts of revenue and expenses during the reporting period. Actual results could differ materially from those estimates.
Our most significant estimates and assumptions are related to revenue recognition with respect to the determination of the relative standalone selling prices for our services; the expected period of benefit over which deferred commissions are amortized; valuation of stock-based awards; estimates of allowance for credit losses; estimates of the fair value of goodwill and long-lived assets when evaluating for impairments; useful lives of intangibles and other long-lived assets; and the valuation of deferred income tax assets and contingencies. We base our estimates on historical experience and on various other assumptions that are believed to be reasonable under the circumstances. Accordingly, actual results may differ materially from these estimates under different assumptions or conditions.
Foreign Currency
The functional currencies of our foreign subsidiaries are the respective local currencies. Translation adjustments arising from the use of differing exchange rates from period to period are included in accumulated other comprehensive (loss) income within our consolidated balance sheets. Foreign currency transaction gains and losses are included in interest and other (expense) income, net in the consolidated statements of comprehensive loss and were not material for fiscal 2022, 2021 and 2020. All assets and liabilities denominated in a foreign currency are translated into U.S. dollars at the exchange rate on the balance sheet date. Revenue and expenses are translated at the average exchange rate during the period, and equity balances are translated using historical exchange rates.
Segment Information
We operate as one operating segment. Our chief operating decision maker is our Chief Executive Officer, who primarily reviews financial information presented on a consolidated basis for purposes of making operating decisions, assessing financial performance, and allocating resources.
Free historical financial statements for Zuora Inc. See how revenue, income, cash flow, and balance sheet financials have changed over 27 quarters since 2018. Compare with ZUO stock chart to see long term trends.
Data imported from Zuora Inc SEC filings. Check original filings before making any investment decision.