
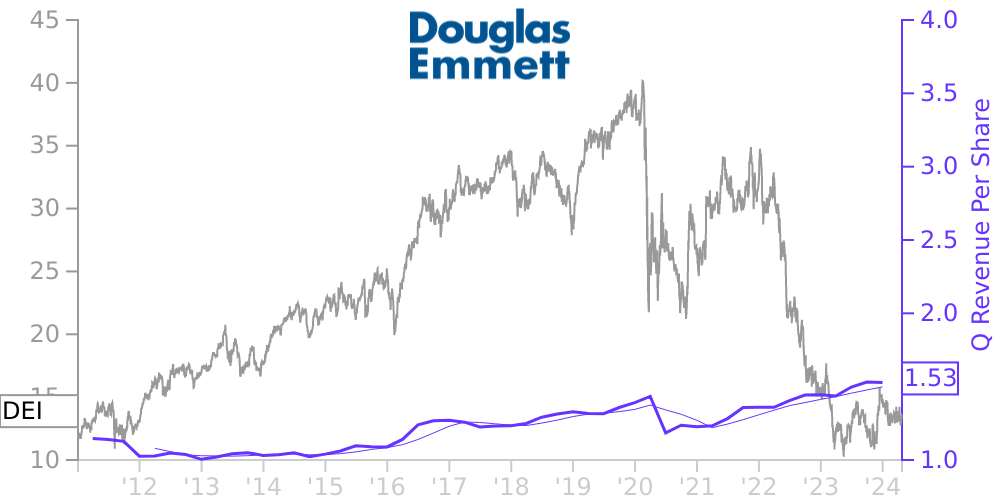
DEI Stock Price Correlated With Douglas Emmett Financials
External Links ⌄
Income Statement
Cash Flow
Balance Sheet
DEI Income Statement
Enable JavaScript and reload
Revenue, Net:
Cost of Goods & Services Sold:
Gross Profit:
Selling, General & Admin Expense:
Research & Development Expense:
Total Operating Expenses:
Operating Income:
Income Taxes:
Net Income:
DEI Cash Flow
Enable JavaScript and reload
Operating Activities Net Income:
Depreciation, Depletion & Amortization:
Change in Accounts Receiveable:
Net Cash from Operations:
Repurchases/Buybacks Common Stock:
Issuance of Long-term Debt:
Cash Dividends Paid:
Net Cash from Financing Activities:
Property, Plant & Equipment Purchases:
Purchases of Businesses, Net of Cash:
Net Cash from Investing Activities:
Net Change in Cash & Equivalents:
DEI Balance Sheet
Enable JavaScript and reload
Cash and Cash Equivalents:
Short-Term Investments:
Accounts Receivable, Net:
Inventories:
Total Current Assets:
Property, Plant & Equipment, Net:
Total Assets:
Accounts Payable:
Current Portion of Long-Term Debt:
Total Short-Term Liabilities:
Long Term Debt, Non-Current Portion:
Total Long-Term Liabilities:
Total Liabilities:
COMPANY PROFILE
Overview Organization and Business Description
Douglas Emmett, Inc. is a fully integrated, self-administered and self-managed REIT. We are one of the largest owners and operators of high-quality office and multifamily properties in Los Angeles County, California and Honolulu, Hawaii. Through our interest in our Operating Partnership and its subsidiaries, consolidated JVs and unconsolidated Fund, we focus on owning, acquiring, developing and managing a substantial market share of top-tier office properties and premier multifamily communities in neighborhoods that possess significant supply constraints, high-end executive housing and key lifestyle amenities. The terms "us," "we" and "our" as used in the consolidated financial statements refer to Douglas Emmett, Inc. and its subsidiaries on a consolidated basis.
At December 31, 2021, our Consolidated Portfolio consisted of (i) a 17.8 million square foot office portfolio, (ii) 4,388 multifamily apartment units and (iii) fee interests in two parcels of land from which we receive rent under ground leases. We also manage and own an equity interest an unconsolidated Fund which, at December 31, 2021, owned an additional 0.4 million
square feet of office space. We manage our unconsolidated Fund alongside our Consolidated Portfolio, and we therefore present the statistics for our office portfolio on a Total Portfolio basis. As of December 31, 2021, our portfolio (not including two parcels of land from which we receive rent under ground leases), consisted of the following properties (including ancillary retail space):
Consolidated Portfolio Total Portfolio Office Wholly-owned properties 53 53 Consolidated JV properties 16 16 Unconsolidated Fund properties — 2 69 71 Multifamily Wholly-owned properties 11 11 Consolidated JV properties 1 1 12 12 Total 81 83
Basis of Presentation
The accompanying consolidated financial statements are the consolidated financial statements of Douglas Emmett, Inc. and its subsidiaries, including our Operating Partnership and our consolidated JVs. All significant intercompany balances and transactions have been eliminated in our consolidated financial statements.
We consolidate entities in which we are considered to be the primary beneficiary of a VIE or have a majority of the voting interest of the entity. We are deemed to be the primary beneficiary of a VIE when we have (i) the power to direct the activities of that VIE that most significantly impact its economic performance, and (ii) the obligation to absorb losses or the right to receive benefits that could potentially be significant to the VIE. We do not consolidate entities in which the other parties have substantive kick-out rights to remove our power to direct the activities, most significantly impacting the economic performance, of that VIE. In determining whether we are the primary beneficiary, we consider factors such as ownership interest, management representation, authority to control decisions, and contractual and substantive participating rights of each party.
We consolidate our Operating Partnership through which we conduct substantially all of our business, and own, directly and through subsidiaries, substantially all of our assets, and are obligated to repay substantially all of our liabilities. The consolidated debt, excluding our consolidated JVs, was $3.41 billion and $3.19 billion, as of December 31, 2021 and December 31, 2020, respectively. See Note 8. We also consolidate three JVs through our Operating Partnership (four JVs before December 31, 2020 - see "2020 Property Disposition" in Note 3 for more information regarding the dissolution of one of our JVs before December 31, 2020). We consolidate our Operating Partnership and our three JVs because they are VIEs and we or our Operating Partnership are the primary beneficiary for each.
As of December 31, 2021, our consolidated VIE entities, excluding our Operating Partnership, had aggregate consolidated assets of $3.56
Free historical financial statements for Douglas Emmett Inc.. See how revenue, income, cash flow, and balance sheet financials have changed over 61 quarters since 2011. Compare with DEI stock chart to see long term trends.
Data imported from Douglas Emmett Inc. SEC filings. Check original filings before making any investment decision.