
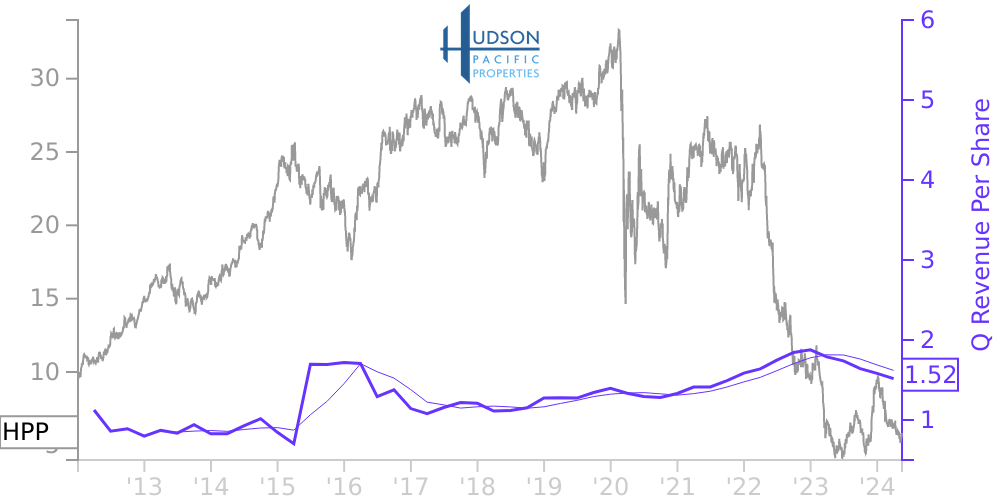
HPP Stock Price Correlated With Hudson Pacific Properties Financials
External Links ⌄
Income Statement
Cash Flow
Balance Sheet
HPP Income Statement
Enable JavaScript and reload
Revenue, Net:
Cost of Goods & Services Sold:
Gross Profit:
Selling, General & Admin Expense:
Research & Development Expense:
Total Operating Expenses:
Operating Income:
Income Taxes:
Net Income:
HPP Cash Flow
Enable JavaScript and reload
Operating Activities Net Income:
Depreciation, Depletion & Amortization:
Change in Accounts Receiveable:
Net Cash from Operations:
Repurchases/Buybacks Common Stock:
Issuance of Long-term Debt:
Cash Dividends Paid:
Net Cash from Financing Activities:
Property, Plant & Equipment Purchases:
Purchases of Businesses, Net of Cash:
Net Cash from Investing Activities:
Net Change in Cash & Equivalents:
HPP Balance Sheet
Enable JavaScript and reload
Cash and Cash Equivalents:
Short-Term Investments:
Accounts Receivable, Net:
Inventories:
Total Current Assets:
Property, Plant & Equipment, Net:
Total Assets:
Accounts Payable:
Current Portion of Long-Term Debt:
Total Short-Term Liabilities:
Long Term Debt, Non-Current Portion:
Total Long-Term Liabilities:
Total Liabilities:
COMPANY PROFILE
Organization Hudson Pacific Properties, Inc. is a Maryland corporation formed on November 9, 2009 as a fully integrated, self-administered and self-managed real estate investment trust (“REIT”). Through its controlling interest in the operating partnership and its subsidiaries, Hudson Pacific Properties, Inc. owns, manages, leases, acquires and develops real estate, consisting primarily of office and studio properties. Unless otherwise indicated or unless the context requires otherwise, all references in these financial statements to “the Company” refer to Hudson Pacific Properties, Inc. together with its consolidated subsidiaries, including Hudson Pacific Properties, L.P. Unless otherwise indicated or unless the context requires otherwise, all references to “our operating partnership” or “the operating partnership” refer to Hudson Pacific Properties, L.P. together with its consolidated subsidiaries.
The Company’s portfolio consists of properties located throughout Northern and Southern California, the Pacific Northwest, Western Canada and Greater London, United Kingdom. The following table summarizes the Company’s portfolio as of December 31, 2021: Segments Number of Properties Square Feet
(unaudited)
Consolidated portfolio Office 53 14,268,741 Studio 3 1,224,403 Land 6 2,504,406 Total consolidated portfolio 62 17,997,550 Unconsolidated portfolio (1)
Office 1 1,500,290 Studio (2)
1 241,000 Land (3)
2 450,000 Total unconsolidated portfolio 4 2,191,290 TOTAL (4)
66 20,188,840
_________________
1. The Company owns 20% of the unconsolidated joint venture entity which owns the Bentall Centre property, 50% of the unconsolidated joint venture entity that owns the Sunset Glenoaks Studios and 35% of the unconsolidated joint venture entity that owns the Sunset Waltham Cross Studios development. The square footage shown above represents 100% of the properties. See Notes 2 and 6 for details.
2. Includes Sunset Glenoaks Studios.
3. Includes land for the Burrard Exchange at Bentall Centre and Sunset Waltham Cross Studios developments. Square footage for Sunset Waltham Cross Studios is yet to be determined.
4. Includes repositioning, redevelopment and development properties.
Concentrations
As of December 31, 2021, the Company’s office properties were located in Northern and Southern California, the Pacific Northwest and Western Canada. The Company’s studio properties were located in Hollywood in Southern California. 77.6% of the Company’s consolidated and unconsolidated properties were located in California, which exposes the Company to greater economic risks than if it owned a more geographically dispersed portfolio.
A significant portion of the Company’s rental revenue is derived from tenants in the technology and media and entertainment industries. As of December 31, 2021, approximately 30.7% and 17.7% of consolidated and unconsolidated rentable square feet were related to the tenants in the technology and media and entertainment industries, respectively.
As of December 31, 2021, the Company’s 15 largest tenants represented approximately 38.7% of consolidated and unconsolidated rentable square feet and no single tenant accounted for more than 10%.
As of December 31, 2021, Google, Inc. represented 12.6% of the Company’s rental revenues for the office segment and no single tenant in the Company’s studio segment had rental revenues representing more than 10% of the segment’s total revenue.
Free historical financial statements for Hudson Pacific Properties Inc.. See how revenue, income, cash flow, and balance sheet financials have changed over 57 quarters since 2012. Compare with HPP stock chart to see long term trends.
Data imported from Hudson Pacific Properties Inc. SEC filings. Check original filings before making any investment decision.