
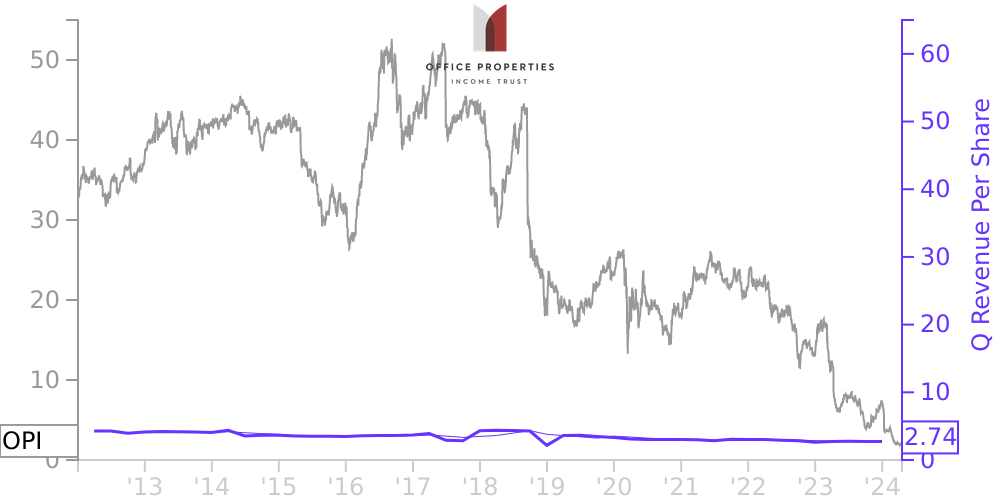
OPI Stock Price Correlated With Office Properties Income Trust Financials
External Links ⌄
Income Statement
Cash Flow
Balance Sheet
OPI Income Statement
Enable JavaScript and reload
Revenue, Net:
Cost of Goods & Services Sold:
Gross Profit:
Selling, General & Admin Expense:
Research & Development Expense:
Total Operating Expenses:
Operating Income:
Income Taxes:
Net Income:
OPI Cash Flow
Enable JavaScript and reload
Operating Activities Net Income:
Depreciation, Depletion & Amortization:
Change in Accounts Receiveable:
Net Cash from Operations:
Repurchases/Buybacks Common Stock:
Issuance of Long-term Debt:
Cash Dividends Paid:
Net Cash from Financing Activities:
Property, Plant & Equipment Purchases:
Purchases of Businesses, Net of Cash:
Net Cash from Investing Activities:
Net Change in Cash & Equivalents:
OPI Balance Sheet
Enable JavaScript and reload
Cash and Cash Equivalents:
Short-Term Investments:
Accounts Receivable, Net:
Inventories:
Total Current Assets:
Property, Plant & Equipment, Net:
Total Assets:
Accounts Payable:
Current Portion of Long-Term Debt:
Total Short-Term Liabilities:
Long Term Debt, Non-Current Portion:
Total Long-Term Liabilities:
Total Liabilities:
COMPANY PROFILE
OrganizationOffice Properties Income Trust, or OPI, we, us or our, is a real estate investment trust, or REIT, formed in 2009 under Maryland law.As of December 31, 2021, our wholly owned properties were comprised of 178 properties containing approximately 23,271,000 rentable square feet and we had noncontrolling ownership interests of 51% and 50% in two unconsolidated joint ventures that own three properties totaling approximately 444,000 rentable square feet.
Free historical financial statements for Office Properties Income Trust. See how revenue, income, cash flow, and balance sheet financials have changed over 54 quarters since 2012. Compare with OPI stock chart to see long term trends.
Data imported from Office Properties Income Trust SEC filings. Check original filings before making any investment decision.