
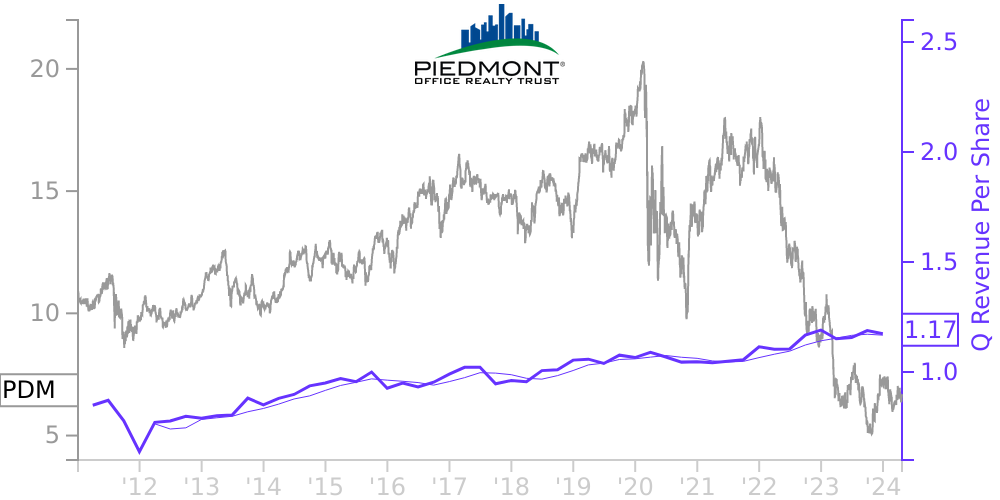
PDM Stock Price Correlated With Piedmont Office Realty Trust Financials
External Links ⌄
Income Statement
Cash Flow
Balance Sheet
PDM Income Statement
Enable JavaScript and reload
Revenue, Net:
Cost of Goods & Services Sold:
Gross Profit:
Selling, General & Admin Expense:
Research & Development Expense:
Total Operating Expenses:
Operating Income:
Income Taxes:
Net Income:
PDM Cash Flow
Enable JavaScript and reload
Operating Activities Net Income:
Depreciation, Depletion & Amortization:
Change in Accounts Receiveable:
Net Cash from Operations:
Repurchases/Buybacks Common Stock:
Issuance of Long-term Debt:
Cash Dividends Paid:
Net Cash from Financing Activities:
Property, Plant & Equipment Purchases:
Purchases of Businesses, Net of Cash:
Net Cash from Investing Activities:
Net Change in Cash & Equivalents:
PDM Balance Sheet
Enable JavaScript and reload
Cash and Cash Equivalents:
Short-Term Investments:
Accounts Receivable, Net:
Inventories:
Total Current Assets:
Property, Plant & Equipment, Net:
Total Assets:
Accounts Payable:
Current Portion of Long-Term Debt:
Total Short-Term Liabilities:
Long Term Debt, Non-Current Portion:
Total Long-Term Liabilities:
Total Liabilities:
COMPANY PROFILE
Organization Piedmont Office Realty Trust, Inc. (“Piedmont”) (NYSE: PDM) is a Maryland corporation that operates in a manner so as to qualify as a real estate investment trust (“REIT”) for federal income tax purposes and engages in the ownership, management, development, redevelopment, and operation of high-quality, Class A office properties located primarily in select sub-markets within seven major U.S. office markets, with a majority of its revenue being generated from Sunbelt markets. Piedmont was incorporated in 1997 and commenced operations in 1998. Piedmont conducts business through its wholly-owned subsidiary, Piedmont Operating Partnership, L.P. (“Piedmont OP”), a Delaware limited partnership. Piedmont OP owns properties directly, through wholly-owned subsidiaries, and through various joint ventures which it controls. References to Piedmont herein shall include Piedmont and all of its subsidiaries, including Piedmont OP and its subsidiaries and joint ventures
As of December 31, 2021, Piedmont owned 55 in-service office properties and one redevelopment asset in select sub-markets located within seven major U.S. office markets: Dallas, Atlanta, Washington, D.C., Minneapolis, Boston, Orlando, and New York. As of December 31, 2021, Piedmont's 55 in-service office properties comprised approximately 17.1 million square feet (unaudited) of primarily Class A commercial office space and were approximately 86% leased.
As of December 31, 2021, Piedmont owned 55 in-service office properties and one redevelopment asset in select sub-markets located within seven major U.S. office markets: Dallas, Atlanta, Washington, D.C., Minneapolis, Boston, Orlando, and New York. As of December 31, 2021, Piedmont's 55 in-service office properties comprised approximately 17.1 million square feet (unaudited) of primarily Class A commercial office space and were approximately 86% leased.
Free historical financial statements for Piedmont Office Realty Trust Inc.. See how revenue, income, cash flow, and balance sheet financials have changed over 61 quarters since 2011. Compare with PDM stock chart to see long term trends.
Data imported from Piedmont Office Realty Trust Inc. SEC filings. Check original filings before making any investment decision.